Candlestick analysis in Forex: definition & patterns
Traders use different instruments for market analysis, combining them for maximum efficiency. Candlestick analysis is one of the universal tools, which gives traders detailed information about the price movement and market sentiment. It allows predicting further changes and getting profit from trading.
What is a candlestick analysis in Forex? What types of candlestick patterns can be and how to use them in trading? We tell you in this article.
Definition of candlesticks in Forex
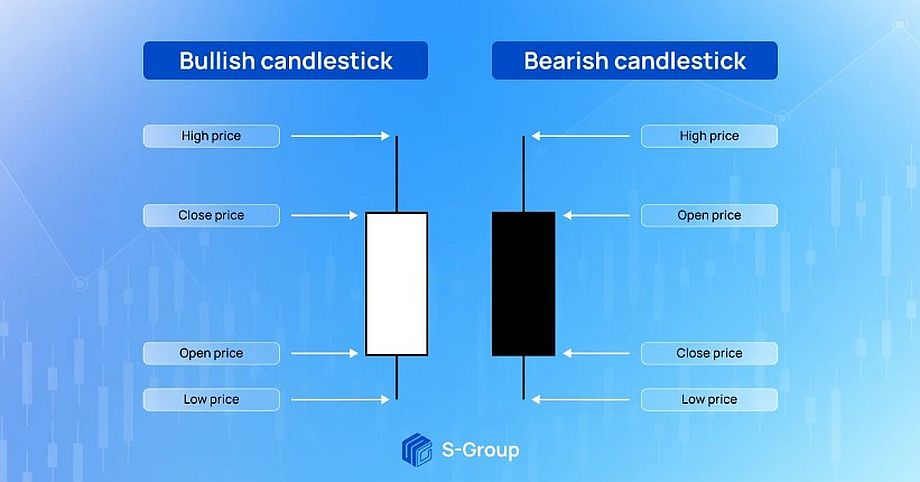
A candlestick is a type of figure on a chart that displays four indicators of price over a certain period of time. It is also called the Japanese candlestick, since this type of chart appeared in Japan at the first rice trading exchanges.
The candlestick figure consists of a “body” (rectangle) and “shadows” (lines going up and down). The candlestick displays the open price, the close price, the highest and the lowest price for the selected time frame. The high price level is called a resistance level and the low price level is called a support level.
There are two types of candlesticks in Forex.
– “Bullish” candlestick – the close price is higher than the open price. The body of such a candlestick is colored white or green. It indicates the dominance of buyers in the market.
– “Bearish” candlestick – the close price is lower than the open price. The body of such a candle is colored in black or red. It indicates the dominance of sellers in the market.
Candlestick analysis allows the trader to see the direction of the market, impulses, current trends and their possible reversals. This tool is fairly easy to understand and gives extensive information about the current market situation, so it is recommended to learn it for beginners. But it is necessary to use candlestick analysis in combination with other instruments of technical and fundamental analysis for efficient trading.
Candlestick patterns: types and uses
Candlestick analysis can be used for different time frames: one hour, a day, a week, a month. The longer the chosen time frame, the more accurate and useful the candlestick chart is for the trader. This is why candlesticks, as a type of technical analysis, are not very informative for short-term trading, such as scalping.
Traders use candlestick patterns to assess the current market situation and predict a possible trend reversal. There is a very large number of these indicators, let us consider the most popular of them.
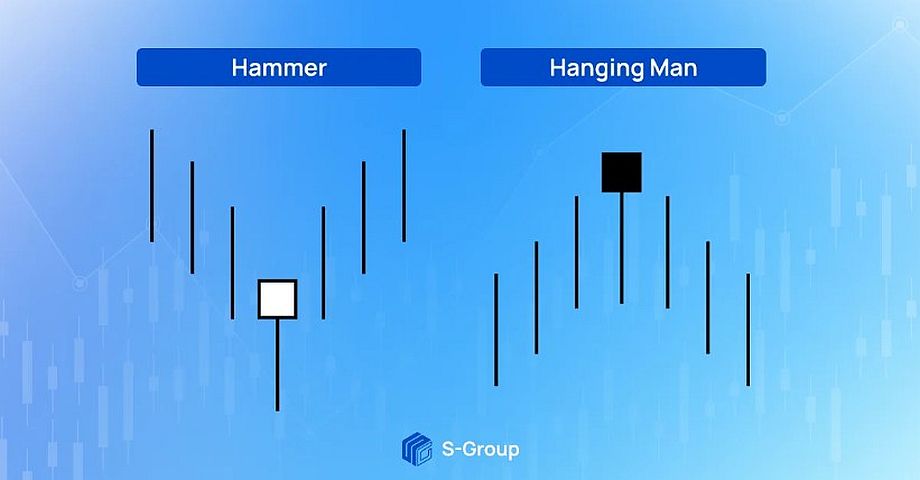
The “Hammer” and “Hanging Man” candlesticks
These candlestick patterns are characterized by a long bottom “shadow” that is twice or more the length of the “body”.
The “Hammer” is a trend reversal indicator, which is usually located at the lower point of a downtrend. It can signal a further “bullish” trend – a price increase.
The “Hanging Man” is a trend reversal indicator, which is usually located in the upper point of an uptrend. It can inform about the beginning of a “bearish” trend – price decrease.
The “Inverted Hammer” and “Shooting Star” candlesticks
These candlestick patterns have a long upper shadow that is twice or more than twice as long as the candlestick “body”. The lower “shadow” is very short or absent.
Indicators “Inverted Hammer” and “Shooting Star” as well as “Hammer” and “Hanging Man” may indicate a trend reversal. The “Inverted Hammer” signals an uptrend and the “Shooting Star” signals a downtrend.
The “Doji” candlestick
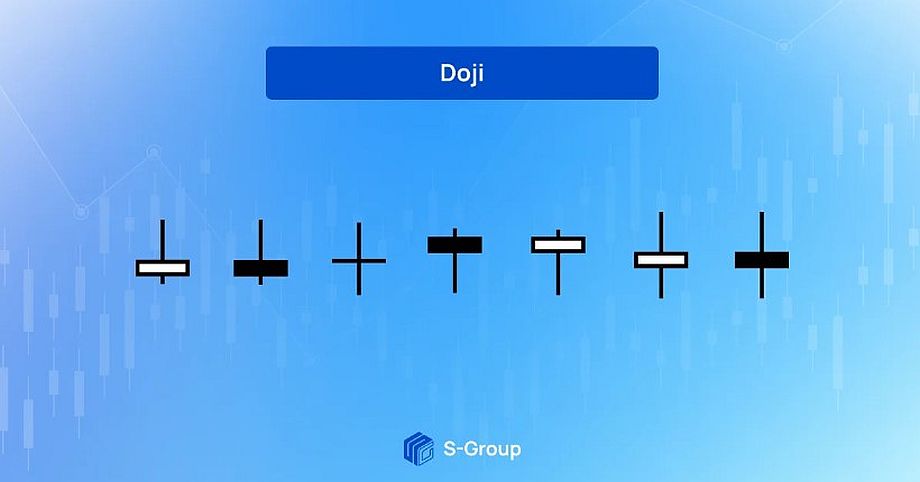
“Doji” is the only candlestick pattern that may not have a “body” or it will be very small. The open and close prices of such a candle are the same or very close to each other.
This pattern appears on a candlestick chart when the market is balanced and there is no obvious dominance of buyers or sellers. If it appears in an uptrend, it may indicate a reversal. A “Doji” candlestick also signals an undefined market sentiment.
The “Engulfing” candlestick
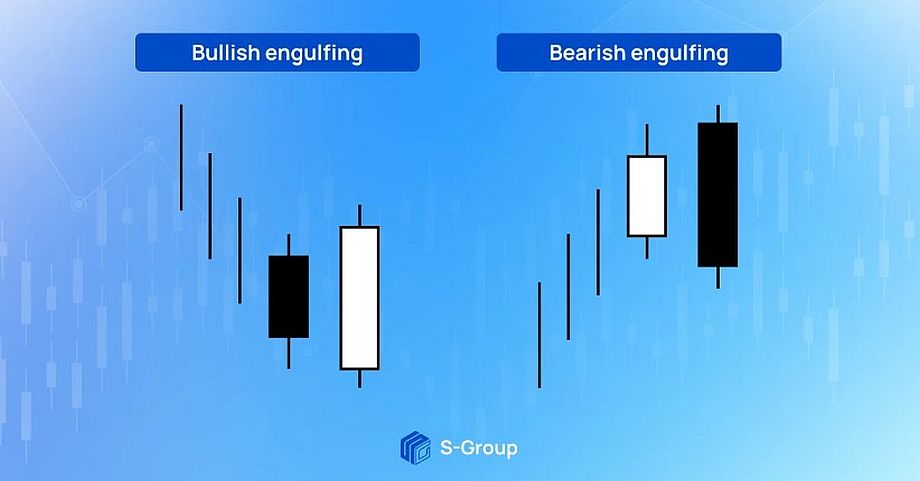
The “bullish engulfing” is a candlestick pattern that signals the reversal of a downtrend and a further price increase. It consists of a “bullish” candlestick, which engulfs the previous “bearish” candlestick.
The “bearish engulfing” is an inverse pattern to the “bullish engulfing” pattern, which means a reversal of the uptrend. This indicator also consists of two candles, only in it the “bearish” one engulfs the “bullish” one.
Using candlestick analysis
Candlestick analysis is an effective tool for identifying market trends, risk management and profitable Forex trading. It can be used to determine several price indicators at once, which is impossible for other types of charts, such as line charts.
Let us summarize and highlight a few basic points about the use of candlestick analysis in trading.
1. Candlestick analysis should be combined with other types of technical and fundamental analysis. It allows traders to look at the market from different sides and evaluate it objectively.
2. To know how to read a candlestick chart, a trader should study the basic patterns and practice it constantly. Candlestick analysis is easy to understand and suitable for beginner traders.
3. The longer the time frame, the more informative the candlesticks on it are. That is why candlestick analysis should be used for day trading and for more long-term strategies.
4. The importance of the indicator depends on the duration of the trend. The longer the trend exists, the more reliable the signal from the candlestick pattern.
5. It is important for the trader to take his time and evaluate the signals on the candlestick chart correctly. Market trends can depend on many factors which are worth considering while trading.


